
Same Weight, Looser Clothes, What the InBody Scan Actually Shows
The scale hasn’t moved. Your jeans have. Here’s what an InBody scan reveals when a bathroom scale keeps lying.
Here’s the reality about scale weight and body composition: when someone says “I haven’t lost a pound but my clothes fit differently,” they’re not confused. They’re describing exactly what should happen during body recomposition. The scale is measuring the wrong variable, and the mirror knows it. An InBody scan is one of the fastest ways to actually see it happening.
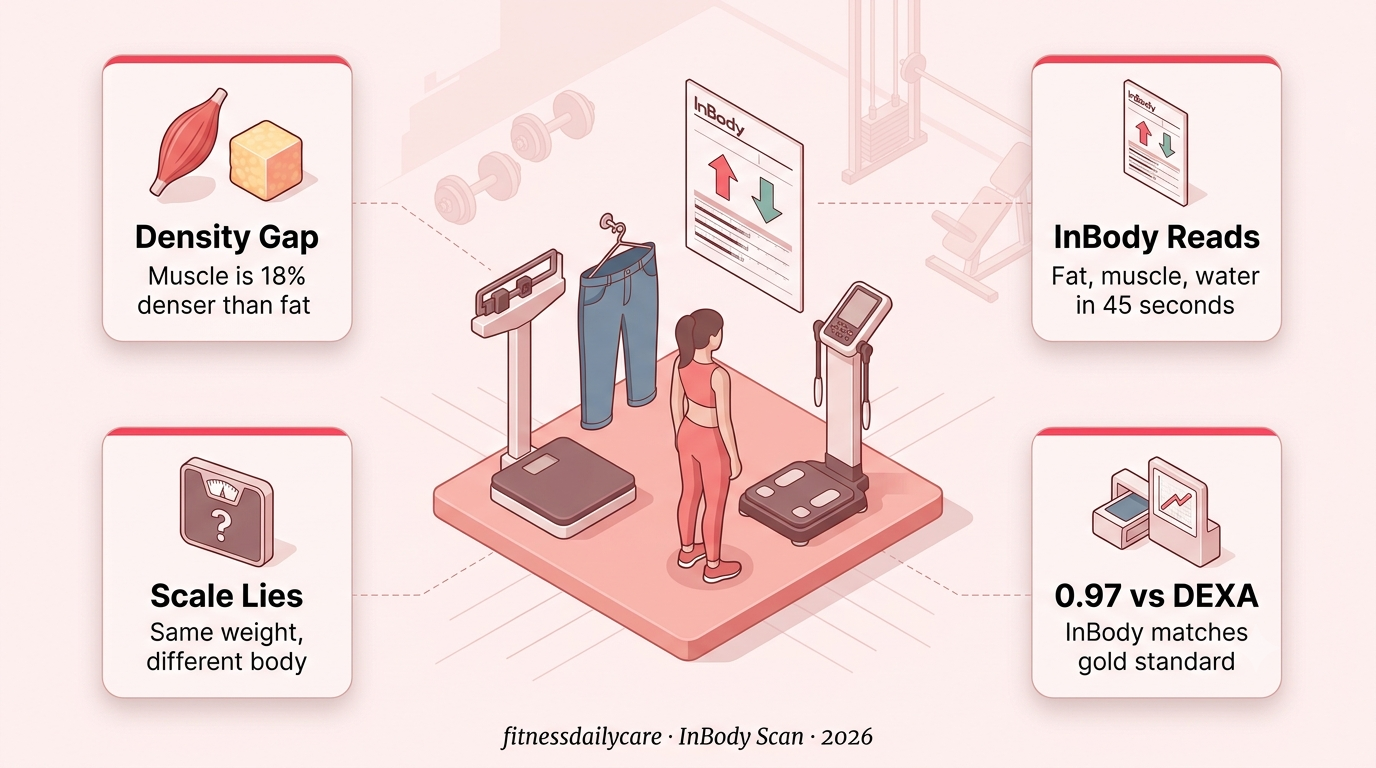
Muscle is roughly 18% denser than fat. That means one pound of muscle takes up meaningfully less space than one pound of fat — a smaller volume for the same weight. If you gain 4 pounds of muscle and lose 4 pounds of fat over three months, the bathroom scale reads identical. Your waist measurement drops. Your jeans get looser. Nothing “worked” by the scale’s math, and everything worked in reality.
What follows is what an InBody scan actually measures, how it stacks up against DEXA (the gold standard), where the ±5% error hides in cheap home scales, and how to time your scans so the numbers actually mean something.
Why weight stays flat during recomp
Muscle is ~18% denser than fat. A 4-pound muscle-for-fat swap looks like zero pounds on the scale but a full inch off the waist. The math is right. The measurement is wrong.
Home smart scales lie by ±5%
Consumer BIA scales are hydration-sensitive and drift meaningfully between days. Use them for trend direction only. Never make training or nutrition decisions from a single home BIA reading.
What an InBody scan reads
InBody uses multi-frequency BIA to break weight into fat mass, skeletal muscle mass, body water (intracellular and extracellular), and segmental analysis — arms, legs, trunk broken out separately.
Who benefits most from an InBody scan
Skinny-fat beginners, returning lifters, GLP-1 users protecting muscle, and anyone in a body recomposition phase where the scale is uninformative. Not everyone needs one, but these groups gain the most signal.
The scale wasn’t lying.
It was answering the wrong question.
Fat mass vs skeletal muscle mass, side by side
The core splitThe single most important number on an InBody printout isn’t total weight — it’s the split between fat mass and skeletal muscle mass. A 155-pound person at 32% body fat and a 155-pound person at 22% body fat share zero body composition despite identical scale weight. The scan gives you both numbers in kilograms and pounds, so change over time is measurable in real units.
Segmental analysis flags muscle imbalances
Where InBody winsInBody 570 and 770 devices produce a segmental readout — left arm, right arm, trunk, left leg, right leg — each measured independently. This flags imbalances that predict injury risk and inform programming. A dominant-side arm carrying 2+ pounds more lean mass than the non-dominant side is common in tennis players, golfers, and desk workers with a bag-carry habit. You can’t see this in a mirror. You can see it in 45 seconds on a scan.
Body water splits explain overnight scale swings
Overlooked metricInBody separates total body water into intracellular water (inside cells, mostly muscle) and extracellular water (blood, lymph, tissue fluid). A high extracellular ratio can indicate inflammation, sodium spike, or overtraining. This is why your weight might swing 3–4 pounds overnight after a high-sodium restaurant meal — the InBody would show extracellular water spiked, not fat gained.
Visceral fat area separates skinny-fat from lean
Health metricInBody 770 estimates visceral fat area — the deep abdominal fat that wraps organs and drives metabolic disease risk. Two people with identical BMI can have wildly different visceral fat readings. The “skinny-fat” pattern shows a normal BMI, normal scale weight, and elevated visceral fat with low skeletal muscle. This is the single reading that best predicts cardiometabolic risk in a normal-weight adult.
Basal metabolic rate estimate anchors calorie targets
Programming inputInBody calculates BMR based on your actual lean mass rather than a generic Harris-Benedict formula plugging in your height and weight. Two people at the same weight can have BMR estimates that differ by 200+ calories per day based on muscle mass. This matters directly for calorie planning: build muscle, and your maintenance calories rise. Lose muscle in a crash diet, and they fall.
Standardize the scan conditions every time
Most important ruleBIA readings shift meaningfully with hydration, food, and recent exercise. To make trend data mean anything, you need consistency. That means same time of day, same fasting state, same hydration, no workout in the past 12 hours. Early morning, fasted, before training is the standard protocol.
Scan every 4 to 8 weeks, not weekly
The right cadenceBody composition changes slowly. Even in aggressive recomposition programs, you’ll add roughly 0.5 to 1 pound of lean mass per month and lose 1 to 4 pounds of fat. Weekly InBody scans mostly measure hydration jitter that swamps the real signal. Monthly cadence is the sweet spot for actionable data; every 8 weeks is fine if scans cost you money.
Pair every InBody with a tape measure and photos
Redundancy winsNo single measurement method is perfect. The gold standard for real-world tracking is the combo: InBody scan + tape measure (waist, hip, arm, thigh) + photos in identical conditions. When two of three agree, you have a real signal. When they disagree, dig into which one is drifting and why. This is how coaches make decisions, not how they market their programs.
Track loads at the gym as your muscle proxy
Free and reliableYou don’t strictly need an InBody scan to know if you’re building muscle. If your working weights on compound lifts (squat, deadlift, bench, overhead press, rows) are climbing while form stays clean, muscle mass is going up. Simple as that. A basic training log is the cheapest and most reliable indirect muscle tracker in fitness. Combine it with the scan for a full picture.
Consider DEXA once a year for calibration
Reality checkDEXA remains the practical gold standard for body composition in most clinical and research settings. It typically runs $60 to $150 at a sports medicine clinic or hospital imaging center. Once a year is plenty. Use it to calibrate — does your InBody trend match the DEXA number in absolute terms? If yes, keep trusting the InBody. If your InBody is consistently reading 3% lower body fat than DEXA, mentally adjust the number and keep tracking the trend.
Weight is one number.
Composition is the whole story.
- Same time of day, fasted — early morning before training and coffee is the standard
- Every 4 to 8 weeks — weekly scans measure hydration noise, not composition
- Pair with tape and photos — waist, hip, arm, thigh circumference plus identical-condition photos
- Track skeletal muscle mass and fat mass separately — the split matters, not the total
- Calibrate against DEXA once a year — validates absolute numbers, keeps trend data honest
⚠️ Where InBody Scans Get Overhyped
1. Home smart scales are not the same technology. Consumer BIA scales share the basic principle but have far fewer electrodes, lower frequencies, and hydration-sensitive readings that swing 3–5% day to day. Trend tracking only. Don’t chase daily body fat readings.
2. Absolute body fat % has ±3% error even on commercial InBody. A reading of 22% could realistically be 19% or 25% on a DEXA scan the same day. Trust the trend across scans more than any single number.
3. Not everyone needs one. If you’re already lean, training consistently, and progressing at the gym, an InBody scan mostly confirms what you already know. It earns its place when the scale is uninformative (recomposition, skinny-fat, post-GLP-1, over 40).